AJNS
NEUROLOGICAL MANIFESTATIONS HIV-INFECTED PATIENTS AROUND VARANASI, INDIA

ABSTRACT

Background
Most of the studies on the neurological manifestations in HIV patients in India were cross sectional in design, and focus on the etiological agents. We report data on the frequency of neurological manifestations, associations with CD4 counts, and outcome of its various presentations in a 3-year prospective hospital-based study.

Methods

All HIV-infected patients attending the Infectious Disease clinic for various neurological manifestations between Jan 2001 and December 2003 were included in the study. Their clinical details, treatment received, and response to treatment were accessed and analyzed.

Results

During this period, 57 had some neurological manifestations and made 145 clinic visits, with 158 distinct episodes of neurological related symptoms, giving a crude rate of 307 neurological episodes per 1000 person year of observation

Conclusion

Opportunistic infections were the leading cause of neurological disorders in our study population. Apart from Central nervous system (CNS) tuberculosis, other CNS diseases were good predictor of the advanced HIV infection (CD4<200). CNS tuberculosis cannot be considered as an opportunistic infection in most of the instances as it can be seen in relatively earlier stages of the disease. Cerebrospinal fluid picture was normal in all our patients of CNS toxoplasmosis. All the patients with progressive multifocal leuco encephalopathy had seizures as the initial manifestation. AIDS-dementia complex and CNS malignancies were not observed in our patients. There were equal responses to Amphoterecin B Cholesterol Dispersion (ABCD) and conventional Amphoterecin B therapies, and no significant differences in their side effect profiles. Key words: infections, HIV, India


Key words: infections, VIH, Inde

INTRODUCTION

India is estimated to have more than 60,000 full-blown AIDS cases by the end of 2005, and this makes it one of its fast growing health problems (13) NACO 2005). The clinical spectrum of HIV infection in India is different from rest of the world, and regional variability has been reported within India (1,2,6,10,11,14,15,16) Central nervous system (CNS) infections are the third commonest cause of morbidity and second commonest cause of mortality in HIV patients (13). There has been no prospective study so far to determine the frequency and pattern of CNS infections in HIV patients in eastern Uttar Pradesh and western Bihar regions. This study was therefore undertaken to provide such baseline information.

METHODS

All HIV infected patients attending the Infectious Disease clinic for various neurological manifestations were included in the study. Sir Sunderlal hospital, affiliated to Institute of Medical Sciences, Banaras Hindu University is a tertiary care teaching hospital with catchments area of five states (Uttar Pradesh, Madhya Pradesh, Bihar, Jharkhand, and Chattisgarh) with 1000 beds. The annual attendance of new HIV cases is approximately 150. HIV related CNS diseases, clinical characters and the treatment outcomes were registered. An informed consent was taken from all the subjects of study prior to investigative procedures. The general work up protocol followed in this study was outlined as below.

graph.jpg

Diagniostic criteria followed

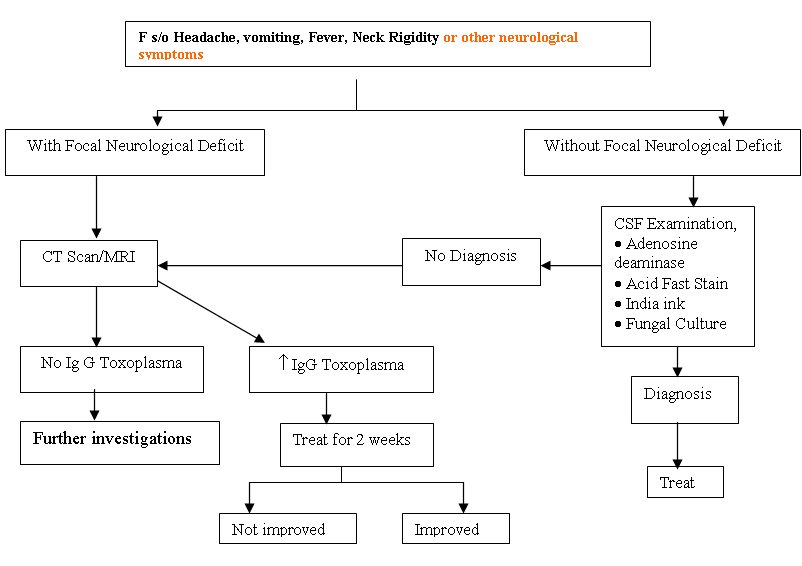
Diagnosis of tubercular meningitis was based on history of sub acute or chronic meningitis, cerebrospinal fluid (CSF) showing increased protein levels, lymphocytic pleocytosis along with raised Adenosine deaminase levels above 7 IU/L, and presence of acid fast tubercular bacilli (AFB). Cryptococcal meningitis was diagnosed by India ink method, or culture demonstrating Cryptococcus or both. Toxoplasmosis was diagnosed by CT/MRI showing multiple ring enhancing lesions, raised Ig G levels and response to treatment. Progressive multifocal leukoencephalopathy was diagnosed by MRI. However we did not perform neuropathological studies of biopsied brain tissue owing to cultural and ethical constraints. Individuals who had no specific identifiable diagnosis were classified as Undiagnosed

CD4 / Viral load estimation

Immuno phenotype of lymphocytes was carried out by FACS count (Becton Dickinson, Singapore (BD). Viral load was not done due to economic constraints.

RESULTS

The study population of 375 patients consisted of individual who had come forward, with the HIV related symptoms. There were no differences in age sex, or clinical stage between patients with and without neurological deficits therefore further comparison was not made. All the patients in the present study were on HAART as all of them have AIDS. During this period, 57 had some neurological manifestations and made 145 clinic visits, with 158 distinct episodes (defined as any visit for the symptoms, for which the etiology or the outcome could be attributable to nervous system), giving a crude rate of 307 neurological episodes per 1000 Person years of observation. The clinical profile of the patients is shown in Table 1.

Table 1: Neurological manifestations

Symptoms/sign (number of patients) CCM (n=16) TBM (n=25) Toxoplasma (n=5) PML (n=3) Undiagnosed (n=8)
Fever (42) 12 (75%) 23 (92%) 1 (20%) 0(0%) 6 (75%)
Headache (40) 14 (87.5%) 20 (80%) 2 (40%) 0(0%) 4(50%)
Focal Neurological Deficit (13)[barring cerebellar signs] 2 (12.5%) 6 (24%) 5 (100%) 0(0%) 0(0%)
Cerebellar signs (5) 1 (6.25%) 1 (4%) 0 (0%) 3 (100%) 0(0%)
Increase Intracranial Tension with meningeal signs (40) 14 (87.5%) 21 (84%) 1 (20%) 0 (0%) 4 (50%)
Seizure (26) 8 (50%) 7 (28%) 2 (40%) 3 (100%) 6 (75%)
Altered sensorium (18) 6 (37.5%) 9 (36%) 3 (60%) 0(0%) 0(0%)
Papilloedema (20) 8 (50%) 10 (40%) 0 (0%) 0(0%) 2 (25%)

CCM = Cryptococcal Meningitis

TBM = Tubercular Meningitis

PML = Progressive Multifocal Leucoencephalopathy

All the patients of PML had seizures and cerebellar symptoms only at presentation there by making PML as one of the important differential diagnosis in all patients with those symptoms in our population. In a similar way presence of fever indicates either CCM or TBM, as most of our patients have either of them. Headache is fairly common in all the patients barring those having PML. Presence of focal neurological deficits (probably secondary to the toxoplasm bodies) strongly argue in favor of toxoplasmosis, the second commonest diagnosis being TBM.

Cerebrospinal fluid examination results were expressed in the below table

Table 2: Cerebrospinal fluid (CSF) findings

CSF finding CCM (n=16) TBM (n=25) Toxoplasma (n=5) PML (n=3) Undiagnosed (n=8)
Cells (/mm3) 20±6 97.4±49.4 6.8±1.3 6.8±1.3 8±2
Neutrophils (%) 0 4±6 0 0 0
Lymphocytes (%) 100 95±6 100 100 100
Protein (mg/dl) 68.6±26.2 186±67 81±14 81±14 42±2
Sugar (mg/dl) 10.3±7.2 30±8 29±8.9 29±8.9 68±24
India ink +ve in 15/16 – ve -ve -ve -ve
ADA (IU/L) 3 8 2 3 0
CD4 (Mean ± SD) 135± 64 190 ± 170 115 ± 82 104 ± 61
CD4 Range 12-245 30-610 12-241 35-153

All the patients with tubercular meningitis had marked lymphocytic pleocytosis (mean cell count of 97.4±49.4) along with raised protein levels (mean 186+67). ADA levels were raised markedly in all the cases (8). In CCM although pleocytosis was seen, it was not so high as in cases of tuberculosis (20+6). There was a mild elevation in protein content, but CSF sugar levels were extremely low (10.3+7.2. CNS toxoplasmosis was suspected in 5 patients with focal neurological deficits. In all the patients, MRI/Double contrast CT showed multiple ring enhancing lesions and IgG levels for Toxoplasma was markedly raised. Four patients responded to therapy. All the patients of progressive multifocal leuco encephalopathy had cerebellar signs, and seizures. Diagnosis was made by MRI. In 8 patients the etiology could not be made out as the patients expired on the very same day of admission and were labled as undiagnosed.
The positive predictive value of the various neurological disorders in predicting the CD4 levels of less than 200 were represented in the table 3 and was compared with other AIDS defining illnesses.

Table 3: Specificity and positive predictive value of few neurological conditions

Disease Specificity (%) Positive predictive value (%)
PML 100 100
Cryptococcal Meningitis 98.1 81.25
CNS Toxoplasmosis 99.3 80
Tubercular meningitis 93.86 73.4
Candidiasis 69.3 38.27
Recurrent Herpes Zoster 97.5 66.6
Molluscum Contagiosum 99.3 83.3
Tubercular Lymphadenitis 87.1 8.6
PCP 97.5 71.4

Table 4: Treatment outcome in different neurological conditions

Disease Treatment No. of patients Response: Improved Response: Not improved Response: Lost in follow up Response: Expired
CCM Ampho B 6 4 0 0 2
ABCD 6 4 0 1 1
fluconazole alone 4 0 0 4 0
TBM RHEZ+Q+S 18 9 2 5 2
RHEZ+S 7 3 2 1 1
Toxoplasma Pyremethamine +Clindamycin 5 4 1 0 0
PML HAART 3 1 0 2 0

ABCD= Amphotericin B Cholesterol Dispersion

RHEZ = Rifampicin +Isoniazide +Ethambutol +Pyrazinamide

S=Streptomycin

Q= Quinalone (ciprofloxacin)

HAART = Highly active antiretroviral Therapy

Most of the patients with TBM in the present study who had a high GCS at presentation improved better with treatment (10/15) when compared with those who came with low GCS (2/10). Out of the 16 patients who presented with the CCM, 4 patients refused any treatment so they were prescribed oral fluconazole desperately. 12 patients were offered Amphoterecin B (6 patients received ABCD + 6 patients received conventional Amphoterecin B). 4 patients from each group survived (total of 8 patients). Out of them 3 patients are still in follow up for more than 13 months. The remaining 5 patients were lost to follow up. Out of the 4 patients who did not respond, 3 patients expired during the treatment and 1 patient left against medical advice. All the patients of PML were prescribed HAART. Single patient is on follow up after 1 year, but 2 patients were lost to follow up after a median period of 5 months. Only a single patient of toxoplasmosis did not responded favorably to the therapy rest all showed complete response to therapy.

DISCUSSION

HIV infection of the CNS results in damage to the nervous tissue and there has been a geometrical increase in the incidence and recognition of neurological disorders in HIV infected individuals over the past decade (14). Majority of the present study population were in advanced stage of HIV disease (AIDS), confirmed by clinical staging and CD4 level. In India the HIV prevalence in males is higher than females (13) so as in the present study where the male female ratio was 3.7:1. Therefore, females and early HIV infection were under represented in the present study. The CNS involvement is broadly classified into three groups viz by HIV, by opportunistic infections and by malignancies.

Opportunistic infections:

With the advent of HAART the incidence of opportunistic infections decreased remarkably in west with non infectious etiologies leading the list of neurological manifestations. However in countries like India where the prevalence of opportunistic infections is high, it is not surprising to see them leading the list of etiology of neurological conditions (1,2,6,10,11,14,15,16) as observed in our study (46/57 i.e. 81%).

CNS Tuberculosis

CNS tuberculosis can be seen at all stages of the disease (5). Associated intracranial mass lesions suggestive of tuberculoma are more commonly reported in HIV positive individuals (60% vs 14%) as compared to those with seronegative TBM (14) But in the present study only single patient (4%) had tuberculoma which is far less compared to the literature. We found that ADA is a better marker to predict response as the mean levels in patients who responded to anti tubercular therapy (ATT) were 9 IU/L compared with those who did not respond (mean level was 6 IU/L). The level of sensorium was also an important marker of outcome. Most of the patients in the present study who had a high GCS at presentation improved better with treatment (10/15) when compared with those who came with low GCS (2/10).

CCM

The incidence of cryptococcal meningitis varies from 5-28% in different countries (14, 11, 15, 1, 10, 16, 6) In the present study seizures were found more frequently than other studies. Amphoterecin B is the main stay of the treatment in CCM. The introduction of liposome form of Amphoterecin has shown promising results without some of the serious adverse effects (4) though the clinical data are insufficient. We observed similar responses with ABCD and the conventional Amphoterecin B, and interestingly no differences in the side effect profile. In view of the small sample size, further speculation is not made here.

CNS toxoplasmosis

The incidence of toxoplasmosis in different studies has been from 1.33% to 3.3% (15, 11, 15, 1, 10, 16, 6) The incidence in the present study was 1.33%, comparable to rest of Indian studies. One of the interesting features is that CSF picture was normal in all our patients.

PML

PML is one of the rare CNS related disorders observed commonly in HIV patients, caused by JC virus. The favorable prognosis in PML include a CD4+ count >100/ L at baseline and the ability to maintain a HIV viral load of <500 copies per milliliter (7). Similar was our findings and only a single patient out of 3 with PML is doing well as his CD4 levels are 182. All the patients of PML in the present study had seizures as their first manifestation, though it is not a gray matter disease. The possible reasons for seizures could be the demyelinated lesions adjacent to the cerebral cortex acting as irrigative foci, axonal conduction abnormalities, or disturbance of the neuron-glia balance. Moulignier et al also reported 10 HIV patients with PML, presenting with partial or generalized seizures as the first neurological manifestations (12) Immune Status and CNS diseases:

Opportunistic infections of the CNS, probably with the exception of cryptococcal meningitis usually follow reactivation of latent infections (14). This suggests that a defect in immunoregulation is the principal mechanism leading to the development of opportunistic infections. This was also supported by the finding of the present study that most of the CNS infections (45/57 i.e.79%) occurred at CD4 levels of less than 200. However, a small number of patients (11/57) with a CD4 count between 200 and 500 also had CNS infections (most of them were tubercular meningitis (7 cases), cryptococcal meningitis (3 cases) and a single case of toxoplasmosis). Moreover, the CD4 count in all the patients with cryptococcal meningitis and toxoplasmosis was in the range of 200-250, suggesting a severe immunocompromized state. However CNS tuberculosis cannot be considered as an opportunistic infection in most of the instances as it can be seen in relatively earlier stages of the disease. Barring CNS tuberculosis, any other CNS disease is reasonably good predictor of the advanced HIV infection (CD4<200). Similar observations were made by various other authors across the globe and the inclusion of tuberculosis in clinical case definition of AIDS in countries where the disease is endemic was questioned in prospective and retrospective studies (3). HIV induced CNS diseases

Primary processes related to HIV infection of the nervous system are reminiscent of those seen with other lenti viruses, such as the Visna- Maedi virus of sheep (9). HIV can affect practically every part of the nervous system ranging from cognitive dysfunction AIDS dementia complex (CNS) to the autonomic neuropathy. It is important to point out that evidence of infection of the CNS with HIV does not imply its role in causation of the disease as 90% of the HIV patients have CNS involvement by HIV though most of them are asymptomatic (9).
The AIDS dementia complex, reported in 66% of the western population is uncommon in India (13%). The rapid improvement in cognitive function noted with the initiation of antiretroviral therapy suggests that at least some component of this problem is quickly reversible (9).We did not encounter even a single case of AIDS dementia complex in our cohort of patients, though majority of our patients were in relatively advanced HIV infection. We could not explain this seemingly paradoxical finding and still studying the cause for the same.

HIV related CNS malignancies

The exact incidence of the CNS malignancies in HIV patients from various parts of India is largely unknown but defiantly les than the west. The non uniform performance of the neuropathological studies, lack of facilities for the diagnosis in most of the centers might contribute to this to some extent. But in the present study also we couldn’t find even a single case of HIV related CNS malignant condition.

CONCLUSION

1. Opportunistic infections are still the leading cause of neurological disorders in our population

2. CNS tuberculosis cannot be considered as an opportunistic infection in most of the instances as it can be seen in relatively earlier stages of the disease. Barring CNS tuberculosis, any other CNS disease is reasonably good predictor of the advanced HIV infection (CD4<200).
3. CSF picture was normal in all our patients of CNS toxoplasmosis.
_4. All the patients with PML had seizures as the initial manifestation

5. AIDS dementia complex and CNS malignancies were not observed in our population

6 We observed similar responses with ABCD and the conventional Amphoterecin B, and interestingly no differences in the side effect profile

SOME CLINICAL AND PSYCHOSOCIAL DETERMINANTS OF INDEPENDENT WALKING ATTAINMENT BY POST STROKE PATIENTS

ABSTRACT

Background

It is not uncommon for post stroke patients or their caregivers to ask the attending physiotherapist when the patient would regain ability to walk. This is often difficult to predict as many clinical and non-clinical factors influence when this function is accomplished.

Objective

To investigate the influence of some clinical and psychosocial factors on the time post stroke individuals commence independent walking.

Methods

The one-group, pre-experimental study carried out in a teaching hospital facility involved 27 (14 males and 13 females) fully conscious, unilateral, first-episode stroke patients admitted to the facility and referred for physiotherapy over 5 months. A daily, structured physiotherapy care including Bobath technique was administered on the patients for 12 weeks. Ages, marital status, years of formal education, occupation, personality type (Eysenck classification), level of disability, co-morbid factors and admission-referral interval were obtained. Main outcome measure was time taken to attain ability to walk a continuous, level floor 10m distance unaided.

Results

The mean time independent walking was attained was 7.4 ± 2.6 weeks. Participants with mild disability level at baseline commenced independent walking significantly earlier (4.00 ± 0.01 weeks) than those with moderate disability (7.72 ± 2.53 weeks). Independent walking attainment time showed no significant difference (p>0.05) across the psychosocial factors. A significant relationship were found between age (r = – 0.57), functional independence measure (r = – 0.55) and commencement of independent walking.

Conclusion

Age and the initial level of disability had significant influence on commencement of independent walking by the participants.

Key Words: Africa, Independent Walking, Psychosocial, Stroke


RESUME

Introduction

Il n’est pas inhabituel pour les patients victimes d’un accident vasculaire cérébral (AVC) et pour leur soignants, de demander aux rééducateurs fonctionnels le délais permettant la reprise de la marche. Ce délai est souvent difficile à prévoir compte tenu des facteurs multiples, à la fois cliniques et non cliniques intervenant dans cette fonction motrice.

Objectif

L’objectif est de définir quelques facteurs cliniques et psychologiques influençant la durée de récupération post-AVC permettant l’autonomie de la marche.

Méthodes

Un groupe préliminaire a été étudié dans un centre hospitalier universitaire et concernaient 27 patients (17 mâles et 13 de sexe féminin) conscients, présentant un déficit unilatéral après un premier épisode d’accident vasculaire. Il ont été suivis dans un centre de physiothérapie durant cinq mois. Une prise en charge quotidienne incluant la technique de Bobath a été instituée pendant douze semaines. Les paramètres suivants ont été étudiés : âge, statut marital, niveau de formation et d’éducation, profession, personnalité (classification d’Eysenck), degré d’invalidité, facteurs de co-morbidité, et de délai de prise en charge.
La principale mesure attestant de la capacité à marcher de manière continue a été une marche continue, sur distance plane de 10 mètres, sans aide.

Résultats
Le temps moyen de reprise de la marche sans aide était de 7.4 ± 2.6 semaines. Les patients avec un handicap moyen ont eu une récupération plus précoce modéré (4.00 ±0.01 semaines) que ceux qui avaient un handicap (7.72 ± 2.53 semaines). Les facteurs psychosociaux n’étaient pas significatifs (p>0.05). Une relation a été objectivée entre l’âge (r = – 0.57), le degré d’indépendance (r = – 0.55), et le début de la marche de manière autonome.

Conclusion

L’âge et le degré d’invalidité avaient une influence significative sur le délai de reprise d’une marche autonome.

Mots clé : Accident vasculaire cérébral, Afrique, Autonomie, facteurs psychosociaux, Marche, Nigéria, Réeducation fonctionnelle.

INTRODUCTION

Stroke is an important cause of long-term disability worldwide, as it results in considerable impairment of sensory, motor, mental, perceptual and language functions [11]. Loss of mobility, major motor function impairment in this group of patients, is closely related to specific medical and non-medical factors such as age 75 years and above, and existence of cognitive disorders [9]. Interventions to improve motor function and mobility therefore forms an important component of stroke management and rehabilitation lead to improved movement pattern regardless of sex, co-morbidity and initial severity of stroke [10].

Independent walking is often used as an indicator of functional recovery in stroke. It is not uncommon for the stroke patients or their carers to ask the Physiotherapist managing the patient when s/he would regain ability to walk. The time this level of function will be attained is usually difficult to predict as many clinical and non-clinical factors such as socio-demographic attributes [2] exert significant influence on stroke outcome, including when the patient would commence independent walking. For example, a study by Warlow [13] had concluded that age; initial mild deficit and early resolution of symptoms, as well as absence of cognitive impairment are good prognostic signs at two weeks post stroke. A retrospective study had also observed that the neurological outcome of stroke was poorer in patients who have diabetes mellitus as co-morbidity than those without [4]. Psychological problems such as mood disorders are reported to have negative impact on rehabilitation outcome [12], while socio-cultural issues like gender-based traditional roles and responsibility assignment practice, as may be found in some cultures including Africans, have also been identified to have potentially significant influence on a post stroke individual in terms of motivation to become independent.

Whereas various studies have been carried out on mobility after stroke, there is paucity of an individual study that considered how some clinical and psychological factors influence the time taken to recover independent walking by individuals who have suffered a stroke. This study was aimed at investigating the possible influence of selected psychosocial and clinical factors on commencement of independent walking in individuals who have suffered a stroke. Specifically this study considered the possible influence of age, marital status, educational qualification, occupation, personality type, disability status, and co-morbidity on recovery of this functional ability. Independent walking was defined in this study as ability to walk a distance of 10 metres on a level floor continuously and unaided.

MATERIALS AND METHODS

Participants

Twenty-seven (14 males and 13 females), unilateral and first episode, freely consenting in-patient stroke victims referred for physiotherapy at the University College Hospital Ibadan, Nigeria were consecutively recruited over a period of 5 months. Ten of them had left-sided and 17 right-sided hemiplegia; 19 had suffered ischaemic while 8 had haemorrhagic CVD, radiologically or clinically diagnosed by the neurologist in charge of the patients.
Only subjects who met the underlisted inclusion criteria participated in the study:

a. Individuals with hemiplegia resulting from first incidence of stroke.

b. Subjects who were not independently ambulant at the time of referral but fully conscious and well oriented in time and place, and had no difficulty communicating and comprehending instructions.

Procedure

The protocol of this study was approved by the Joint Ethical Committee of the University of Ibadan/University College Hospital, Ibadan, Nigeria (IRC Protocol No: UI/IRC/03/0080). Every new stroke patients referred for physiotherapy was initially evaluated by one of the authors to determine whether they meet the study criteria or not. The procedure involved was explained to the prospective participants who satisfied the inclusion criteria before obtaining their informed consent. They were however blinded to the main outcome measure (independent walking attainment time). The following parameters were obtained at the point of recruitment:

Social Factors: Age in years, sex, marital status, level of formal education, total years of education and occupation. Occupations were categorized into: Trading; civil-service; artisan; retired.

Psychological Factors: The personality type of the patients was determined using the Eysenck personality type questionnaire (EPQ). A validity of 0.9 and internal consistency of 0.84 has been reported for this instrument [3]. It was researcher-administered and each subject responded to the questions by answering either “Yes” or “No”. A score of 1 was given to “Yes” and zero to “No”. The total score was added up in each category of 4 different personality types- introvert, extrovert, psychotic and neurotic. The personality type where the subject scored the highest determined his/her personality.

Clinical Factors: Side of affectation, presence of co-morbid factors (hypertension and or diabetes mellitus only), the time interval between admission to the hospital and when referred for physiotherapy (admission-referral interval) were also determined, as appropriate, from physical examination and the medical records of each participant.

Level of disability was determined by administering the functional independent measure (FIM) instrument, which assesses the physical and cognitive level of disability in the hemiplegic stroke subject. Each subject was asked to perform the basic life activities listed on the FIM instrument and scored accordingly. The FIM has a reliability coefficient of 0.93 and a validity score 0.84.

Structured Physiotherapy Intervention

Each participant received structured physiotherapy care. This included positioning in bed, respiratory physiotherapy and functional mobility activities which were based on the Bobath approach to management of hemiplegia. Treatment was administered daily, each session lasting 45 minutes. This was continued until the subject was ready to commence walking. Independent walking was determined by asking the subject to perform a continuous 10-metre floor walk in the physiotherapy gymnasium at his/her self selected walking velocity and without any assistive device or support from the therapist. The duration of participation in this study by each subject was 12 weeks. This is the most common upper limit admission time for stroke patients receiving physiotherapy at this hospital facility. Treatment of individual patient however continued until discharge from the physiotherapy unit on out-patient basis.
Obtained data were analysed using SPSS package. Mann-Whitney U, Kruskal-Wallis and Pearson correlation coefficient (r) were calculated, as appropriate, at 0.05 alpha.

RESULTS

Twenty eight participants were recruited but one of them could not complete this study, as he was transferred to another hospital upon request by his family members. The results presented in this report are therefore with respect to the 27 subjects (13 females and 14 males) that completed the study.
The mean quantifiable parameters of the participants such as age, independent walking attainment time and admission-referral interval are presented in table 1. The results of Mann-Whitney U statistical test as presented in table 2 shows that participants with mild disability level at baseline commenced independent walking earlier than those with moderate disability (p<0.05). Comparison of independent walking attainment time by psychosocial factors showed no significant difference (p>0.05) across these factors (Table 3). Correlation analysis using Pearson product moment correlation coefficient (r) showed that both age and functional independence measure have statistically significant association (p<0.05) with independent walking attainment time (Table 4). DISCUSSION

One of the indicators of functional recovery from stroke is independent walking, which promotes discharge home. Many clinical and non-clinical factors would affect when this functional level is attained. The objective of this study was to investigate the influence of some clinical and psychosocial factors on the time independent walking was attained by stroke patients who received a 12- week structured physiotherapy care. In this study, independent walking was taken to be ability of a stroke patient to walk a distance of 10 metres unaided and continuously.

The mean time for commencement of independent walking was 7.4 ± 2.6 weeks in this study. Whereas no statistically significant sex differential was observed in the time of commencement of independent walking, it took the female participants a longer period (7.92 ± 2.81 weeks) than their male counterparts (7.00 ± 2.54 weeks) to achieve this task. Only 25% of the participants commenced walking within five (5) weeks and 70% within twelve (12) weeks of the structured physiotherapy care. Pomeroy and Tallis [10] had reported that 56% of their stroke patients regained independent walking 6 weeks after referral to physiotherapy. In general the time independent walking status is attained by stroke victims differ greatly and this variation can be attributed to several factors such as age, severity of the stroke, co-morbidity and rehabilitation approach. Differences in these factors may account for the disparity in the result of this study and the earlier report [10].

Age was found to have a negative correlation with time of commencement of independent walking, suggesting that the older the subjects, the earlier they commence independent walking. Contrary to this observed trend, a previous report had concluded that the cumulative effects of aging on the cardiovascular system and many chronic illnesses commonly seen in older adults are predictive of worse functional outcome, longer length of stay in the hospital and greater disability following rehabilitation [8]. The disparity in the findings may be attributed to other associated psychosocial and clinical factors that vary in the stroke subjects in these two studies.

Each of marital status, level of formal education, total years of education and occupation had no significant influence on time of commencement of independent walking, and by inference are not determinants of this important measure of functional recovery. Other studies had however reported that socio-economic factors [6] and the presence of a spouse at home [5] are factors that may accelerate functional recovery and discharge home of stroke patients. In this study only one-fifth of the patients were not married. This non-significant difference in the marital status of the patients could have accounted for the non-difference observed in the recovery time of independent walking across marital status. In addition, unlike the earlier study[5] which identified presence of a spouse at home as a positive influencing factor on recovery from stroke, the participants in this present study were still hospitalized at the time of this study. Therefore, the likely influencing effect of a spouse at home on recovery may not be established at this stage of recovery. The distribution of participants by occupation and level of formal education was also not significantly different in this study.

The side of affectation, admission-referral interval and co-morbid factors did not significantly influence the time of commencement of independent walking by our subjects. However we observed that the subjects who had hypertension as the only co-morbid factor commenced independent walking earlier than their counterparts who were both hypertensive and diabetic. The neurological outcome of stroke has been observed to be poorer in patients with diabetes than those without diabetes [4], thus suggesting that occurrence of diabetes mellitus as a co-morbid factor in stroke patients may prolong functional recovery in stroke. A stroke patient who has associated diabetes mellitus especially with complication such as peripheral polyneuropathy, which causes tingling sensation and numbness in the feet, may not be motivated to practice standing which is a prerequisite to walking.

Level of disability of the subjects had a significantly negative influence on the time they commenced independent walking in this study. The trend was such that subjects with mild disability at baseline commenced independent walking earlier (4.00 ±0.01 weeks) than those with moderate disability (7.72 ± 2.53 weeks). Initial disability would therefore be a negative influencing factor on recovery of independent walking by post stroke victims. A group of researchers[9] who observed that patients with mild and moderate disability had functional recovery within 2 months and 3 months respectively had concluded that the most important factor for functional recovery from stroke remains the initial severity of stroke.

Time of commencement of independent walking was not significantly different across the four personality types in these subjects. This suggests that their personality, a cognitive function, did not influence commencement of independent walking,although cognitive make-up had been observed to be one of the psychological factors that exert a major impact on patient’s rehabilitative functioning. Psychological adjustment was also reported to significantly enhance rehabilitation from a physical disability and a major contributing factor to the disability itself [7]. It is possible that other clinical and non-clinical factors modulated the potential influence of personality of the participants in this study. These include non-clinical factors like socio-cultural practice in this African community where the extended family practice ensures that a hospitalized stroke patient is surrounded by family caregivers. The regular presences of these family caregivers may serve as motivational factor that may dampen the likely influence of the patient’s own personality profile on recovery post stroke.
A major drawback of this study is the relatively small sample size. Also, although the participants received structured physiotherapy care, they were at different stage of recovery at the time of recruitment to the study. This could have contributed to some of the trends observed in this study.

CONCLUSION

The mean time for commencement of independent walking was 7.4 ± 2.6 weeks for all subjects and 4.00 ±0.01 weeks for those with mild disability at the point of recruitment into the study. Older age and a high score on the FIM scale generally characterized early commencement of independent walking.

Acknowledgement
The authors would like to acknowledge all patients who participated in the study and the physiotherapists working at the department of physiotherapy, University College Hospital, Ibadan Nigeria for their cooperation during this study. The editorial assistance from Bisi Hamzat of Bital Consultancy Nigeria while preparing this manuscript is also acknowledged.

Table 1: Mean Quantifiable Parameters of the Subjects (N=27)

Variables range mean ± SD
Age (years) 38.0 – 75.0 56.96 ± 10.49
Years of education 0.0 – 18.0 11.52 ± 5.93
Admission-referral interval (Days) 1.0 – 30.0 8.11 ± 6.58
Functional Independence measure 60.0 – 94.0 76.63 ± 7.88
Independent walking attainment time (days) 4.0 – 14.0 7.44 ± 2.61

Table 2: Comparison of the Mean Independent Walking Attainment Time by Clinical Factors Using Mann-Whitney U (N = 27).

Variable Mean ± SD U-Value p
Sex
Male (n = 14) 7.00 ± 2.54 73.00 0.38
Female (n = 13) 7.92 ± 2.81
Side of affectation
Right (n = 17) 7.47 ± 2.37 72.00 0.64
Left (n = 10) 7.40 ± 3.13
Co-morbid factor
HTN (n = 21) 7.00 ± 2.28 40.50 0.18
HTN + DM (n = 6) 9.00 ± 3.35
Level of disability
Mild (n = 2) 4.00 ± 0.001 1.00 0.03*
Moderate (n = 25) 7.72 ± 2.53

Key: * = significant U at p ≤ 0.05, HTN = hypertension, DM = Diabetes Mellitus

Table 3 Comparison of the Mean Independent Walking Attainment Time by Psychosocial Factors Using Kruskal Wallis K (N = 27).

Variable Mean ± SD K-value p
Personality types
Psychotic (n = 8) 8.57 ± 3.20
Neurotic (n = 10) 7.25 ± 2.26 2.57 0.46
Extrovert (n = 6) 6.40 ± 3.29
Introvert (n = 3) 7.33 ± 1.15
Level of education
None (n = 2) 5.00 ±1.41
Primary (n = 8) 8.38 ±2.83 4.62 0.20
Secondary (n = 5) 8.40 ± 2.70
Tertiary (n = 12) 6.83 ± 2.41
Occupation
Trading (n = 10) 8.10 ± 3.35
Civil-servant (n= 7) 6.86 ± 2.91 2.32 0.51
Retired (n = 6) 6.50 ± 1.22
Artisans (n = 4) 8.25 ±1.26
Marital status
Single (n = 0) 0.00
Married (n = 22) 7.18 ± 2.34 2.40 0.30
Separated (n = 2) 11.00 ± 4.24
Widowed (n = 3) 7.00 ± 3.00

Table 4: Correlation between Independent Walking Attainment Time and Age, Years of education, Admission-Referral Interval and F.I.M score.

Variables r – value p – value
Age – 0.57 0.00*
Years of education – 0.08 0.71
Admission-referral interval 0.02 0.91
Functional independence measure – 0.55 0.00*

Key: * = significant r at p ≤ 0.05

PRISE EN CHARGE DES MANIFESTATIONS NEUROLOGIQUES DE LA PRE- ECLAMPSIE SEVERE ET DE L’ECLAMPSIE PAR LE SULFATE DE MAGNESIUM A COTONOU

RÉSUMÉ

Le sulfate de magnésium(MgSO4) utilisé depuis des décennies aux USA est reconnu plus efficace que le diazépam ou les phénytoînes dans la prévention et le traitements des crises d’éclampsie, responsables d’une mortalité élevée.

Objectif

Evaluer l’efficacité et la tolérance du MgSO4 en milieu africain à Cotonou(BENIN) où la fréquence et la létalité dues à l’éclampsie demeurent des plus élevées.

Matériel et méthode

Il s’agissait d’une étude à la fois rétrospective et prospective à visée descriptive et analytique menée pendant 30 mois à l’Hôpital de la Mère et Enfant Lagune(HOMEL) de Cotonou. L’échantillon était constitué de patientes présentant une pré- éclampsie sévère ou une éclampsie et qui étaient traitées par MgSO4 en dose d’attaque et d’entretien. L’administration du produit était rigoureusement surveillée afin de diagnostiquer un surdosage. L’efficacité de MgSO4 était évaluée sur l’amendement des signes neurologiques, le score d’APGAR à 1 et 5 mn de vie, la morbidité et la mortalité maternelles et néonatales étant comparées à celles rapportées dans une série de 2001à l’HOMEL.

Résultats

760 cas sur 17.753 accouchements étaient colligés (4,28% des accouchements ) ; 211 (âge moyen 24,74 ans) étaient traités par du MgSO4. Les pressions artérielles systolique et diastolique étaient comprises respectivement entre 160- 200 et 110- 120 mm Hg dans 83 et 86% des cas, accompagnées de crises convulsives(63%), d’obnubilation et de coma (13 et 12% respectivement) • L’efficacité du MgSO4 était nette en termes d’amendement complet des crises convulsives (54% des cas) dès l’administration de la dose d’attaque. Le score d’APGAR était satisfaisant à la 1ère et 5ème mn de vie respectivement chez 69 et 84% des nouveaux- nés. La mortalité néonatale et la létalité maternelle (de 4 et 0,94% respectivement) étaient améliorées par rapport aux taux d’une série de 2001 (de 20,8 et 8,05% respectivement) à l’HOMEL de Cotonou avant l’introduction du MgSO4.

Conclusion

Le sulfate de magnésium sous réserve d’une surveillance clinique rigoureuse était réellement efficace sur les manifestations neurologiques de la pré- éclampsie sévère et de l’éclampsie.

Mots clés: Manifestations neurologiques – Pré- éclampsie sévère – Eclampsie – MgSO4- BENIN.


SUMMARY

The sulphate of magnésium(MgSO4) used since decades in USA is recognized more efficient than diazépam or phenytoïns in the prevention and the treatment of the eclampsia seizures, responsible of an elevated mortality.

Objectif

To Value the efficiency and the tolerance of MgSO4 in African environment in Cotonou(BENIN) where the frequency and the lethality due to éclampsia stay of the most elevated.

Material and method

It was a retrospective and prospective, analytic and descriptive survey achieved during 30 months in the Mother and Child Hospital Lagoon(HOMEL) of Cotonou. The sample was constituted of patients presenting preeclampsia and eclampsia neurological symptoms and who were treated by MgSO4 in attack and maintenance dose. The treatment was supervised to diagnose overdose. The efficiency of MgSO4 was valued on the neurological sign amendment, the score of APGAR at 1 and 5 min. of life, the maternal and neonatal morbidity and mortality and néonatales being compared to those returned in a set of 2001at the HOMEL.

Results

760 cases on 17.753 childbirths were collected (4,28% of the childbirths); 211 (middle age of 24,74 years) were treated by MgSO4. Systolic and diastolic arterial blood pressures were consisted respectively between 160 – 200 and 110 – 120 Hgs mm in 83 and 86% of the cases, accompanied by seizures(63%), obnubilation and coma (13 and 12% respectively). The efficiency of MgSO4 was clean in terms of complete amendment of the seizures (54%) since the administration of the attack dose. The score of APGAR was satisfactory at the 1st and 5th minites of life respectively at 69 and 84% of the new – born. The neonatal mortality and the maternal lethality (of 4 and 0,94% respectively) were improven in relation to the rates of a set of 2001 (of 20,8 and 8,05% respectively) at the HOMEL of Cotonou before the introduction of MgSO4.

Conclusion

MgSO4 subject to a rigorous clinic follow up was really efficient on the neurological manifestations of the preeclampsia and eclampsia .


Key words : neurological manifestations – Preeclampsia – Eclampsia – MgSO4 – BENIN.

INTRODUCTION

Les manifestations cliniques et systémiques de la pré- éclampsie et de l’éclampsie mettent en jeu le pronostic vital maternel. Les formes sévères n’ont pas diminué et représentent 4 à 18% des accouchements dans certains pays d’Afrique[3,17]. Si des progrès sensibles ont été accomplis dans la compréhension de la physiopathologie, aucun test clinique, biophysique ou biochimique ne permet de faire le dépistage et la prévention de la pré- éclampsie[4].

D’après plusieurs études multicentriques, le sulfate de magnésium(MgSO4) par comparaison aux bezodiazépines, phenytoïnes et autres antiépileptiques majeurs, est un anti convulsivant qui a fait la preuve de son efficacité dans la prévention et le traitement des crises convulsives de l’éclampsie. L’essai clinique randomisé MgSO4 versus placebo sur la prévention des crises convulsives au cours de la pré- éclampsie[14], a noté un risque réduit de la survenue d’éclampsie et un taux de létalité maternelle faible dans le groupe traité (0,8%)par rapport au groupe placebo(1,9%) ; de plus , il a été noté une grande différence en termes de morbidité maternelle et néonatale par hématome rétro placentaire par rapport au groupe placebo. D’autres travaux [9,11] ont rapporté que ce produit a permis de prolonger les grossesses associées à une toxémie sévère et s’est avéré plus efficace que les anti épileptiques dans le traitement des crises d’éclampsie.

En matière de prévention de récidives des crises d’éclampsie, il a été démontré que MgSO4 en réduisait les risques (2% dans le groupe traité) par rapport au diazépam (9% de récidives) avec une différence statistique significative (p<0,00001) [13]. De plus, la létalité est diminué par rapport à celles qui avaient eu un traitement par phénytoïne ou diazépam.[6].Le but de notre étude était d'évaluer l'efficacité et la tolérance du MgSO4 au cours des manifestations neurologiques de la pré- éclampsie sévère et de l'éclampsie en milieu africain à Cotonou.
Objectifs : Déterminer la fréquence de la pré- éclampsie et de l’éclampsie à l’Hôpital de la Mère et Enfant Lagune (HOMEL) de Cotonou, en identifier les manifestations neurologiques spécifiques, évaluer l’efficacité et la tolérance du traitement par le sulfate de magnésium et le pronostic maternel et néonatal.

I. MATÉRIEL ET MÉTHODE

Nous avons mené une étude à la fois rétrospective et prospective à visée descriptive et analytique du 1er septembre 2002 au 31 avril 2005 soit 30 mois à l’Hôpital Mère et Enfant Lagune(HOMEL) de Cotonou.

Définitions

La pré-éclampsie sévère [14] est définie(chez toutes gestantes) par la mesure à deux occasions d’une pression artérielle diastolique(PAD) supérieure ou égale(>=) 110 mm Hg, ou d’une pression artérielle systolique(PAS) >= 170 mm Hg et d’une protéinurie largement supérieur à 0,40mg/l.
L’éclampsie est la survenue de crises convulsives avec ses trois phases tonique, clonique et résolutive.

Le sulfate de magnésium(MgSO4) [14,16] est un anti convulsivant qui augmente la production des prostaglandines vasodilatatrices et induit une vasodilatation générale en particulier cérébrale avec comme corollaire une réduction de l’ischémie cérébrale; il inhibe les récepteurs du calcium(antagoniste calcique) et la transmission neuro- musculaire par diminution de la libération de l’acétylcholine. Il diminue l’excitabilité neuronale, ralentit la conduction cardiaque, inhibe l’agrégation plaquettaire et la libération de certaines cytokines ; il induit un abaissement des résistances vasculaires systémiques et protégerait également les cellules endothéliales des lésions induites par les radicaux libres.
Etaient incluses dans l’étude les patientes qui présentaient une pré- éclampsie sévère ou une éclampsie au cours de la gravido- puerpéraliité et avaient reçu du sulfate de magnésium (critère essentiel d’inclusion). Etaient exclus les cas non traités par le MgSO4.

Le recueil des données était clinique et biologique centré sur les chiffres de la pression artérielle diastolique(PAD) et systolique(PAS), les crises convulsives, le coma, l’oligurie, l’obnubilation, la fréquence respiratoire _ la protéinurie /glycosurie(qualitative), le taux d’hémoglobine et la numération des plaquettes, la créatininémie, l’uricémie, les transaminases, le taux de prothrombine(TP) et le temps de céphaline kaolin(TCK). La protéinurie des 24 heures n’était pas évaluée.

Le protocole de MgSO4 que nous avons utilisé était celui rapporté par PALOT et al. [9]; il consistait pour la dose d’attaque en l’injection intra- veineuse lente (IVL) sur une durée de 15 à 20 mn de 4g de MgSO4 concentré à 20% de produit actif , suivi de 10g concentré à 50% de produit actif en injection intra- musculaire(IM) ( 5g dans chaque muscle fessier) ; la dose d’entretien était de 5g à 50% en IM(2,5g dans chaque fesse) toutes les 4 heures. La surveillance du traitement était axée sur le contrôle des paramètres définis par HADDAD[ 6 ] à savoir : les réflexes ostéo- tendineux (ROT), la fréquence respiratoire et la diurèse dont les altérations étaient synonymes de surdosage ; lequel était traité par l’arrêt du MgSO4, la ventilation sous masque ou après intubation, l’oxygénation, le remplissage vasculaire(en veillant à éviter la surcharge hydrique) associé ou non au furosémide jusqu’à la reprise de la diurèse, l’administration de l’antidote le gluconate de calcium. Le traitement antihypertenseur venait en appoint.

L’évaluation de l’efficacité du MgSO4 était basée sur l’amélioration des signes neurologiques (convulsions et coma notamment) et de la pression artérielle ; le score d’APGAR (supérieur ou égal à 8) à 1ou 5 minutes était jugé satisfaisant ; les taux de létalité maternelle, de la mortinatalité et de décès néonatals étaient comparés à ceux rapportés dans une série sur les syndromes vasculo- rénaux sévères en 2001 à l’HOMEL avant l’introduction du MgSO4.
Les tests statistiques étaient réalisés sur le logiciel SPSS version 10.5 pour la analyser la distribution des données et calculer les moyennes.

Au plan éthique, les patientes ou leurs parents avaient donné leur consentement après une information médicale détaillée sur le traitement actuel de la pré- éclampsie sévère et de l’éclampsie par le sulfate de magnésium, les bénéfices et les effets secondaires de cette molécule ; la confidentialité devait entourer les données informatisées.

II. RÉSULTATS

2.1 Fréquence

760 cas de pré-éclampsie sévère et d’éclampsie étaient colligés pendant la période d’étude sur 17.753 accouchements (4,28%) et 211 traités par le sulfate de magnésium (MgSO4) dont 74 et 137 respectivement de pré- éclampsie sévère et d’éclampsie (1,27et 3,01% des accouchements) ; 151cas étaient survenus dans la période gravidique, péri ou per- partum et 60 dans le post- partum

2.2 Caractéristiques des patientes traités par le MgSO4

  • L’âge moyen était de 24,75ans ; 69 (32,70%) s’étaient auto- référées et 142(67,30%) référées des maternités périphériques ; les nullipares114cas(54%) étaient les plus représentées, respectivement suivies par les primipares et paucipares 46 et 22 cas
    (22 et 11%) cas.
  • Les signes neurologiques notées à l’admission mettaient d’emblée en jeu le pronostic vital maternel (Tableaux n°1 & 2 )
  • Données biologiques
    Au niveau sanguin, la créatininémie (normale = 5 à 12mg/l ) était comprise entre 12 et 61,86mg/l dans 3cas; l’uricémie(normale inférieure à (<) 60mg/l) était supérieure(>) à 60mg/l chez 4 avec un taux extrême à 118,12mg/l.

    Le taux d’hémoglobine moyen était de 9,36 g/dl, d’hématocrite < 30% dans 14 cas, entre 30 et 35 % et > 35% dans 16 et 1cas ; la numération des plaquettes montrait une thrombopénie inférieure à 100.000 éléments/dl chez une patiente ; le taux de prothrombine (TP) était inférieur à 70 % dans un cas.

    Les transaminases (normale < 30 UI/L ) étaient supérieures à 30 UI/L pour les ASAT dans 3 cas. Le groupage sanguin O, A et B était noté respectivement dans 14 cas, 6 et 7cas.
  • Données obstétricales
    63 gestantes ( 41,72 %) avaient bénéficié de l’examen échographique ; le terme moyen était de 36,99 semaines d’aménorrhée (SA) ; dans 66,22 % des cas, l’âge de la grossesse était supérieur ou égal à (>=) 37 SA.•L’indice de masse corporelle (IMC) était < 20 kg/m2 chez 16 patientes entre 20 et 29 kg/m2 chez 6 et >= 30 kg/m2 chez 4.

    Etat fœtal : Le rythme du cœur fœtal était normal (entre 120- 16Obpm) dans 80%
    des cas, montrait un ralentissement (< 120) et une accélération ( > 160bpm) respectivement dans 5 et 2% des cas.

2.3 Prise en charge par le MgSO4

La dose d’attaque avait été administrée aux 211 cas (100%) ; la dose totale était
comprise entre 14 et 44g et la dose moyenne par patiente de 27g ; 163 patientes avaient reçu une dose > 27g.
Les effets secondaires notés consistaient en bouffées de chaleur(65%).

  • La surveillance du traitement (Tableau n°4)
    203 avaient bénéficié d’une surveillance rigoureuse (96%) et 8(4%) d’une surveillance irrégulière.
  • Les résultats du traitement par le MgSO4
    – Dans l’éclampsie (n= 137) : Amendement total des crises convulsives dans les
    24 heures : 130/137 cas(95%) ; 1 à 3 crises convulsives résiduelles entre la 24ème et la 72ème heure dans 7 cas (5%).
    – Dans la pré- éclampsie sévère(n= 74) : Prévention totale de survenue de crises convulsives chez 74/74(100%).
    – La durée moyenne du traitement était de 32h. Le traitement du surdosage était assuré sans difficulté selon le protocole décrit dans la méthodologie.

2.4 Les traitements médicaux d’appoint contribuaient à stabiliser la pression artérielle et l’hémodynamique(Tableau n°5).

  • L’association sulfate de magnésium- clonidine semblait amélioré la pression artérielle dans 199 cas ; cependant, une aggravation(PA >230 mm Hg) et un état stationnaire étaient notés respectivement dans 2 et 10 cas.
  • Le remplissage vasculaire était nécessaire (en contrôlant la surcharge hydrique) dans 94% des cas et le furosémide(40 à 80 mg en IVL) dans 13% devant une oligurie persistante.

2.5 Prise en charge obstétricale et résultats

  • Chez les 151 gestantes (140 grossesses de singleton et 11gémellaires), le travail d’accouchement a duré en moyenne 4heures(extrêmes 1 et 11heures) suivi d’accouchement spontané dans 41cas, d’application de forceps et de césarienne respectivement dans 3 et 110 cas; 173 naissances étaient enregistrées dont les poids de naissance étaient normaux dans 45% des cas (Tableau n° 6).

2.6 Pronostic

  • Le pronostic maternel était marqué par un œdème aigu du poumon (OAP) et un accident vasculaire cérébral (AVC), 7 et 2 cas respectivement d’état de mal convulsif et de psychose puerpérale et 2 décès sur 211(0,95 %).
  • Pronostic fœtal : 119(69%) et 146(84%) nouveau-nés avaient un score d’APGAR satisfaisant respectivement à la 1ère et 5ème mn ; cependant chez 27(16%) le score d’APGAR était resté
    bas( inférieur à 7) à la 5ème mn. La morbidité fœtale était marquée par l’hypotrophie chez 93 nouveau-nés (54 %), la prématurité et la détresse respiratoire respectivement chez 64 et 46
    37 et 27%), la mortinatalité et la mortalité néonatale respectivement de 19 et 7cas (11 et 4%).

    2.6 La durée moyenne d’hospitalisation était de 8 jours avec des extrêmes de 2 et 47 jours ; 59% avaient séjourné moins de 7 jours à l’HOMEL. A la sortie de l’hôpital, 199 et 12 patientes respectivement avaient une PAS comprise entre 110 et 130 et supérieure ou égale à 140 mm Hg, toutes suivies dans un service de cardiologie.

III. DISCUSSION

La fréquence des pathologies vasculo- rénales sévères de la grossesse était de 2,9% des accouchements en 2001 à l’Hôpital de la Mère et Enfant Lagune (HOMEL) de Cotonou [1] et de 4,28% dans notre étude dont 3,01% d’éclampsie, taux supérieur à ceux notés au Togo et au Burkina Faso[2,7] ; l’âge moyen de nos patientes(24,75ans) était similaire à celui rapporté dans ces séries africaines.Les formes sévères de la pré- éclampsie et de l’éclampsie compliquent 0,1% des accouchements dans plusieurs régions d’Afrique ; elles sont à l’origine de près de 30 millions de cas d’hypotrophie fœtale, de 12,4% de décès néonatal précoce, de sévère retard mental et des difficultés scolaires dans les pays en développement[8,18].

Les manifestations neurologiques que nous avons relevées dans notre série menaçaient d’emblée le pronostic vital maternel; leur prise en charge immédiate s’avérait impérative.
Outre le traitement visant à assurer la liberté des voies aériennes (dans les cas d’éclampsie) et à faire baisser la pression artérielle, le sulfate de magnésium était administré en dose d’attaque et d’entretien ; l’efficacité du produit était remarquable en termes de résolution complète des convulsions dans la quasi totalité des cas. Et la prévention des crises convulsives était totale chez 100% des patientes traitées pour une pré- éclampsie sévère.
Ces résultats encourageants corroboraient les faits rapportés dans les séries randomisées sur l’efficacité du MgSO4 comparé au diazépam, à la phénytoïne ou au placebo[ 6,14].
En matière de prévention de récidives des crises d’éclampsie, plusieurs études [19,13] ont montré que MgSO4 réduit ces risques et donne les meilleurs résultats par rapport aux autres anti- convulsivants ; de plus, les patientes sous MgSO4 avaient un risque diminué de décès.

Surveillance clinique du traitement
Nous avions noté une altération des paramètres de surveillance dans certains cas. Aucun auteur n’inclut la magnésémie dans la surveillance d’un traitement par MgSO4; la surveillance clinique suffit dans la mesure où l’abolition des ROT précède de beaucoup la dépression respiratoire[9] ; MgSO4 nécessite des précautions de surveillance toutes les 15 mn les deux premières heures du traitement puis toutes les heures par la suite. La corrélation entre la magnésémie et la surveillance est figurée sur le tableau no7.

Dans notre étude , une patiente sur cent avait présenté un état de mal convulsif ayant nécessité une intubation trachéale et une ventilation assistée. PRITCHARD et al. cités par TREISSER [16], ont insisté sur la possibilité d’une intoxication mortelle par le MgSO4 si une prompte intubation et une ventilation assistée ne réussissait pas à améliorer la situation.

L’association clonidine- MgSO4 semblait améliorer les chiffres élevés de la pression artérielle neuf fois sur dix chez nos patientes. Des complications respiratoires ont été rapportées lors de l’utilisation conjointe de MgSO4 et de nifédipine[9]. Nos résultats méritent une étude randomisée pour confirmer ou infirmer l’effet bénéfique de l’association clonidine- MgSO4 sur l’amélioration de l’hypertension artérielle au cours de la prééclampsie sévère et de l’éclampsie.

Pronostic

  • Les complications maternelles que nous avions enregistrées sont bien documentées dans la littérature scientifique[3,5,12,15]. La létalité maternelle hospitalière enregistrée dans notre série (0,95%) était améliorée par rapport à celle de 2001 (8,05%) à l’HOMEL lorsque cette pathologie n’était traitée que par le diazépam ou la phénytoïne et les anti- hypertenseurs[ 1]. L’éclampsie est responsable de 5,2% de décès maternels par an dans les pays en développement et de 0,72% dans les pays industrialisés et la pré- éclampsie respectivement responsable de 0,4 et 0,034%[17].
  • Le pronostic néonatal était satisfaisant ; il a été noté que MgSO4 n’altérait pas le bien- être fœtal, ne retentissait pas sur la circulation ombilicale mais augmentait le débit des artères utérines ; les enfants des groupes traités par cette molécule ont de meilleurs scores d’APGAR à une minute de vie et une durée de séjour moins longue en unité de soins intensifs que ceux des autres groupes[ 9]. Dans deux cas sur dix, le score d’APGAR resté inférieur à 7 chez nos nouveau- nés, pouvait être expliqué par l’hypotrophie, la souffrance fœtale chronique et la prématurité, morbidités très fréquentes dans la pré- éclampsie sévère et l’éclampsie[8,12,15,18]. La mortinatalité et la mortalité néonatale respectivement de 11 et 4% dans notre série étaient améliorées par rapport à la série rapportée en 2001 à l’HOMEL où elles étaient de 44,1 et 20,8% respectivement [1].

CONCLUSION

Au plan thérapeutique et pronostic le sulfate de magnésium a montré une efficacité et une tolérance remarquables en termes de réduction des récidives des crises d’éclampsie, de prévention des convulsions dans la pré- éclampsie sévère. Par ailleurs l’amélioration de la morbidité et mortalité maternelles et périnatales étaient spectaculaires comparée à une étude menée en 2001 sur les syndromes vasculo- rénaux sévères dans cette même maternité de référence nationale. Mais ce travail doit être complété par d’autres essais cliniques randomisés MgSO4 versus diazépam/phénytoïne en milieu africain.

Tableau I : Les signes de gravité

ncas (%)
Crises convulsives 137 (64,92)
Obnubilation 28 (13,27)
Coma 25 (11,84)
Oligurie 06 (2,84)

Les crises convulsives dominaient la symptomatologie neurologique.

Tableau II : Valeurs des pressions artérielles systoliques(PAS) et diastolique(PAD).

ncas (%)
PAS
<160 mm Hg 17 (8,06)
160 -200 mm Hg 175 (82,94)
>200 mm Hg 19 (9,00)
PAD
<110 mm Hg 5 (2,36)
110 – 120 mm Hg 181 (85,79)
>120 mm Hg 25 (11,85)

Les PAS et PAD moyennes étaient respectivement de 175,45 et 110,45 mm Hg.

Tableau III : Protéinurie / Glycosurie(qualitative)

ncas(%)
Protéinurie
-1+ 02(1%)
-2+ 127(60%)
-3+ 34(16%)
Glycosurie*
-1+ 06(3%)
-2+ 03(1,5%)
-3+ 04(2%)

La glycosurie était négative dans 149cas.

Tableau IV : Paramètres de surveillance du traitement par le MgSO4

ncas
Diurèse (Normale >= 30ml/h )
< 30ml/h 06
30 à 50 ml/h 35
50 à 75 ml/h 62
75 à 100 ml/h 86
> 100 ml/h 12
ROT
Normaux 89
Vifs 88
Diminués 23
Abolis 11
Fréquence respiratoire(cycles/mn)*
Bradypnée(< 16/mn) 1
Eupnée(16-20/mn) 58
Polypnée(>20/mn) 62

ROT= réflexes ostéo- tendineux.

L’altération des paramètres de surveillance était surtout marquée au niveau des ROT.

Tableau V : Traitement antihypertenseur.

n cas (%)
Clonidine* 210 (99,53)
Méthyl-dopa 90 (42,65)
Nifédipine 2 (0,94)
Nicardipine 3 (1,42)
Aténolol 2 (0,94)

* La clonidine (utilisée sous la forme générique) était l’antihypertenseur de référence le plus employé dans les services obstétricaux à Cotonou

Tableau VI : Poids de naissance.

n cas (%)
≤ 1000 g 4 (2,31)
1001 à 1500 g 10 (5,78)
1501 à 1999 g 29 (16,77)
2000 à 2499 g 50 (28,90)
2500 à 3999 g 78 (45,09)
≥4000 g 2 (1,15)
Total 173 (100,00)

La majorité des nouveau- nés avaient un poids normal.

Tableau VII : corrélation entre la magnésémie et la surveillance [6]

Magnésémie(mg/dl) Surveillance clinique
1,5- 25 Concentrations normales
4- 8 Concentrations thérapeutiques
9 -12 Pertes des réflexes ostéo tendineux
12- 17 Paralysie musculaire et respiratoire
30 -35 Arrêt cardiaque
ETUDE IRM DES SEQUELLES LESIONNELLES POST – TRAUMATISME CRANIEN

RESUME

Introduction

Dans les pays industrialisés les déficiences cérébrales sont souvent dues aux séquelles des traumatismes crâniens. L’IRM est une technique d’imagerie cérébrale pouvant préciser les types de lésions à long terme.

Matériel et Méthode

Dans une étude rétrospective, en 2003 et 2004, nous avons analysé 75 dossiers d’expertise post – traumatique à l’Université Libre de Bruxelles (ULB). Les séquelles cérébrales ont été explorées à l’IRM . Ont été exclus les patients qui ont subi une intervention chirurgicale cérébrale.

Résultats

75 cas de traumatisés cérébraux ont été répertoriés ; 64,4% sont de sexe masculin, l’âge moyen était de 35 ans (7 à 80 ans) ; 40 cas avait une lésion séquellaire cérébrale. Les lésions axonales diffuses ont été retrouvées dans 11 cas dont 5 cas en région péricalleuse, 2 cas avaient une atteinte des pédoncules cérébelleux. La plupart de ces lésions étaient situées dans l’interface substance blanche/substance grise. Des lésions focales de la base du cerveau étaient observées dans 10 cas. Les séquelles cortico-sous corticales étaient les plus fréquentes, 26 cas . L’hémosidérine est un indicateur à long terme de l’atteinte cérébrale.

Conclusion

Nous concluons que l’IRM est une excellente technique pour étudier les séquelles cérébrales traumatiques et permet d’établir leur pronostic.

Mots-Clés : IRM. Neurotraumatologie. Traumatismes crâniens, Séquelles cérébrales.


ABSTRACT

Background

Disabilities are frequent in western countries and may be due to cerebral traumatic sequella. MRI with high resolution is an excellent technique to visualise cerebral sequella.

Materials and Method

In a retrospective study, we reviewed 75 cases of traumatic sequella at the Université Libre de Bruxelles (ULB), in 2003 and 2004 explorated with MRI. We excluded patients who underwent cerebral surgery.

Results

Focal sequellea cortical and cortico-sub cortical are most frequent, 26 patients. Hemosiderin and encephalomalacia atrophy are common signs. Diffuse Axonal Injury were found in 11 cases, focal sequella of brain sterm in 10 cases.

Conclusion

We concluded that RMI is an excellent technic of imaging cerebral sequella.

Key words: Brain trauma, Head injuries, Head trauma, Cerebral sequella, MRI.

INTRODUCTION

Dans les pays industrialisés, on estime que 13 à14 % de la population vit avec un certain degré d’incapacité ou de limitations fonctionnelles [12]. L’une des causes de ces déficiences est le traumatisme en particulier cérébral qui entraîne des altérations séquélaires cérébrales dont on évalue mal l’importance avec les moyens d’imagerie médicale classiques (Radiographie du crâne et Tomodensitométrie).

L’Imagerie par Résonance Magnétique (IRM) a fait progresser nos connaissances sur les séquelles du cerveau, permettant ainsi d’établir une cartographie lésionnelle et parfois leur degré de sévérité. Le présent essai vise à décrire l’apport de cette technique à l’évaluation de ces séquelles.

MATERIEL ET METHODE

Il s’agit d’une étude rétrospective d’analyse de dossiers de patients victimes de traumatisme cérébrale et prises en charge à la clinique neuroradiologique de l’hôpital de ULB (Université Libre de Bruxelles) en 2003 et 2004.
Ont été inclus ceux qui ont bénéficié d’un examen IRM cérébral dans le cadre d’une expertise commise pour l’analyse des séquelles cérébrales de leur traumatisme.
Les examens ont été réalisés sur un appareil de 1,5 T (Marque Philips); les acquisitions systématiquement obtenues comportaient des coupes sagittales T1, axiales T2, axiales FLAIR suivies de coupes fines de 1.8 mm 3D T1 axiales et coupes axiales et coronales en technique ECHO de GRADIENT T2.

Certaines acquisitions complémentaires ont été faites: séquence angiographique en contraste de phase 3D, séquence de diffusion et séquence en densité protonique pour exclure une ischémie ou préciser une atteinte de la substance blanche.

Ont été exclus de l’étude les dossiers des patients qui ont subi une intervention chirurgicale au décours du traumatisme.

Les séquelles cérébrales traumatiques résultent d’une résorption de nécrose le plus souvent hémorragique ; elles se traduisent par la gliose et/ou l’encéphalomalacie associée à terme à l’atrophie cérébrale. Les dépôts d’hémosidérine résultent du métabolisme de l’hémorragie. L’IRM permet actuellement de différencier ces états lésionnelles.

RESULTATS ET COMMENTAIRE

Au total 75 dossiers ont été retenus. L’âge de ces patients variait de 7 ans à 80 ans avec une moyenne de 37 ans ; 64,4% étaient de sexe masculin contre 35,5% de femmes. 40 ont présenté des séquelles lésionnelles.
Le temps qui séparait le traumatisme de la date d’exploration a varié de 5mois à 390 mois. La plus longue durée d’existence de foyer d’hémosidérine a été de 163 mois.

A – SEQUELLES DES LESIONS AXONALES DIFFUSES

Les lésions axonales diffuses correspondent à un cisaillement axonal dans l’aire de séparation entre la substance blanche et la substance grise et sont consécutives à des mouvements de rotation ou d’accélération/décélération au cours desquels l’axone est soit simplement désinserré, soit rompu de même que les capillaires afférents; ce qui leur confère un caractère souvent hémorragique [14].

Au stade aigu la Tomodensitométrie (TDM) est l’imagerie d’urgence; elle permet la mise en évidence de foyers hémorragiques souvent macroscopiques. Les lésions axonales diffuses devraient être moins évoquées que dans la phase séquélaire et lorsque l’exploration est faite à l’IRM; cette technique est sensible à l’hémorragie et à son évolution; elle démontre mieux les séquelles de lésion axonale diffuse par l’existence de dépôts d’hémosidérine à des endroits typiques [3].

Dans notre étude les séquelles des lésions axonales diffuses hémorragiques ont été prédominantes; chez les 11 patients qui ont présenté ce type de séquelles, le corps calleux, la région péri-calleuse ou la région sous épendymaire étaient atteints dans 5 cas, les pédoncules ponto-cérébelleux, dans 2 cas. (Fig n°1)

Fig n°1: Séquelles de LAD hémorragiques.

La plupart des séquelles hémorragiques ont été localisées au niveau de l’interface substance blanche substance grise du lobe frontal dans 7 cas, du lobe pariétal 3 cas et du lobe temporal dans 2 cas. (Fig n°2)

Fig n°2 : séquelle de LAD hémorragiques.

Un traumatisme moyen ou modéré peut occasionner des lésions axonales sans traduction parenchymateuse ou des lésions axonales non hémorragique [1].

Le diagnostic de leurs séquelles parait moins évident en TDM qu’à L’IRM qui est très sensible aux anomalies de la substance blanche [3]. L’acquisition en densité protonique, le siége et la diffusion des lésions ont aidé à leur diagnostic. (Fig n°3)

Fig n°3 : séquelle de LAD non hémorragiques.

D’autres facteurs tels la configuration gyrale, la direction des fibres neuronales et des vaisseaux cortico-médullaires, les phénomènes de réparation axonale, la taille ou le volume des axones lésés, le délai d’exploration devraient affecter les aspects lésionnels et évolutifs des lésions axonales diffuses [1,4,11]. Il devrait même exister des séquelles non démontrées tant en TDM qu’en IRM (3).

B – SEQUELLES DES LESIONS FOCALES

Le dommage traumatique focal initial évolue vers la nécrose qui, en général, résulte d’une résorption d’hématome; ce qui explique la présence de dépôts d’hémosidérine souvent associée aux séquelles focales. Elles se traduisent par la gliose et l’encéphalomalacie; l’atrophie est une conséquence directe de la perte de volume tissulaire [3].

La TDM a une mauvaise résolution notamment dans l’exploration de la base du cerveau et dans la région adjacente aux structures osseuses. La sensibilité et la résolution de l’IRM permettent de mieux limiter l’encéphalomalacie et l’acquisition FLAIR permet de la différencier éventuellement en 2 zones; la cavité porencéphalique en hyposignal, entouré de la gliose en hypersignal.

Le mécanisme de choc direct et leur conséquence physiopathologique de lésions de contre-coup, les engagements dans des orifices herniaires spécifiques, la force de diffusion traumatique et les phénomènes ischémiques justifient la répartition spatiale de ces séquelles [9, 10, 13].

LES SEQUELLES FOCALES DE LA BASE DU CERVEAU

Ces séquelles ont été observées chez 10 patients; quasiment toutes sont issues de contusions hémorragiques, dans un cas seulement on a noté la présence d’encéphalomalacie isolée.

Elles ont surtout atteint le diencéphale, 6 cas; englobant soit plusieurs noyaux ou un noyau isolément. (Fig n°4)

Fig n°4

Les séquelles du tronc cérébral ont été essentiellement mésencéphaliques, 4 cas et metencéphaliques, 2 cas; le myéloencéphale n’a pas été atteint dans cette étude. (Fig n°5)

Fig n°5 : Séquelles de lésions de la base

Certaines structures de la base paraissent plus exposées, l’issue de l’évolution clinique des traumatismes devrait conditionner leur fréquence.

LES SEQUELLES CORTICALES ET CORTICO-SOUS CORTICALES.

Les séquelles corticales et cortico-sous corticales sont plus fréquentes que les séquelles de la base; 26 patients ont présenté ces 2 types de séquelles; dans seulement 1/3 des cas l’atteinte était purement corticale. L’association encéphalomalacie, dépôts d’hémosidérine, atrophie focale a été très fréquemment observée.

Les séquelles ont siégé plus souvent dans les lobes frontaux dans presque la moitié des cas, les lobes temporaux dans 1/3 des cas, et moins souvent dans les lobes pariétaux; elles ont été rares dans le lobe occipital et le cervelet. (Fig n°6)

Fig n°6: séquelles des lésions corticales et cortico-sous corticales.

La répartition lobaire des lésions, observée dans cette étude, est classiquement reconnue (5).Si leur mécanisme semble relever de traumatisme modéré, leur grand nombre peut être source de trouble de conscience grave au stade aigu [6,9].

C – SEQUELLES D’HEMORRAGIE MENINGEE ET D’HEMATOME SOUS DURAL.

4 cas de séquelles d’hémorragie sous arachnoidienne ont été enregistrées et ont justifié la réalisation de séquence complémentaire d’ARM qui n’a pas montré d’anomalie vasculaire sous jacente. (Fig n°7)

Fig n°7 : séquelles d'hémorragie méningée et sous durale.

Les dépôts d’hémosidérine étaient observés dans les méninges de la vallée sylvienne dans un cas, plus étendus dans un autre cas, de la fosse postérieure dans 2 cas.
Deux cas d’hématome sous dural spontanément résolutif sont révélés par des dépôts d’hémosidérine à la convexité pariétale et au niveau de la tente du cervelet.
La résolution spontanée de l’hématome sous dural de petit volume est signalée [10].
Aucun de ces patients n’a présenté d’hydrocéphalie.

D – EVOLUTION ET DEGRE DE SEVERITE.

Plusieurs évaluations pronostiques du traumatisme cérébral au stade initial, à partir des résultats d’exploration IRM, ont été publiées [7,8,15]. Le mauvais pronostic semble être multifactoriel.

L’isolement de la séquelle, avec des facteurs pronostiques indépendants, n’a pas fait l’objet de beaucoup de publications. L’hydrocéphalie et l’atrophie diffuse sont des éventualités à court ou long terme des séquelles traumatiques [4]. Les séquelles des structures de la base du cerveau seraient de mauvais pronostic à 6 mois [13]. Les dépôts d’hémosidérine peuvent persister des années durant; à ce titre ils ont été considérés comme des marqueurs des LAD [10].

Le développement de l’amnésie post-traumatique est un phénomène qui n’est pas encore bien compris [4]. Un espoir peut être fondé sur l’IRM Spectroscopique; elle peut évaluer les anomalies biochimiques liées au traumatisme à la phase aigue et tardive, même sur des sites apparemment sains [2].

CONCLUSION

L’IRM, plus que la TDM, est une excellente technique pour étudier les séquelles cérébrales traumatiques. Les dépôts d’hémosidérine, l’encéphalomalacie versus atrophie sont les anomalies les plus observées.

L’IRM Spectroscopique aiderait encore à mieux comprendre le devenir des traumatisés crâniens.

INTRAVITREAL TRIAMCINOLONE IN TREATMENT OF DIFFUSE DIABETIC MACULAR EDEMA: FUNCTIONAL AND ANATOMIC EVALUATION

ABSTRACT

Background

Diabetic macular edema is a major cause of visual loss in patients with diabetes mellitus.

Methods

This is a clinical interventional, nonrandomized comparative study aimed to investigate the efficacy of intravitreal injection of 4mg (0.1ml) triamcinolone acetonide as primary treatment for chronic diffuse diabetic macular edema. Included in this study were 24 patients, their age ranged from 38-65 years (55.25±17.94) and the duration of visual deterioration ranged from 8-36 months (21.75±13.83). As baseline and at the end of the first, third and sixth month(s) follow up periods after injection, assessment of the patients was done functionally and anatomically by measuring the visual acuity (VA), visual evoked potential (VEP) and macular thickness and volume using Optical Cohedence Tomography (OCT).

Results

Marked improvements were observed at the end of 1-, 3- and 6-months follow up periods. At the end of the first, third and sixth month(s) follow up periods, visual evoked response showed marked improvement in amplitude from initial 7.31±2.23 to 15.37±3.88 (P<0.001), 26.69±3.72 (P<0.001) and 25.65±2.28µV (P<0.001). All patients showed marked improvement in visual acuity. Macular thickness was reduced from initial 375±35.50 to 233.33±40.17 (P<0.001), 145.83±27.58 (P<0.001) and 202.46±29.60 micron (P<0.01), respectively. Macular volume was reduced from initial 10.39±1.87 to 7.73±1.01 (P<0.001), 6.55±0.99 (P<0.01) and 6.61±1.09 micron (P<0.01). Intraocular pressure (IOP) was elevated from 13.92±3.85 to 20.58±8.42 mmHg (P<0.001) after the first month of injection and decreased significantly to 15.83±4.15 mmHg and 14.63±1.46 (P<0.001, P<0.001 and P=NS) at the end of the first, third and sixth months follow up periods. However, 25% of the patients developed recurrence of edema at the end of sixth month and necessitated re-injection.
Conclusions

We concluded that 1) Intravitreal triamcinolone acetonide is a safe effective primary treatment of diffuse chronic diabetic macular edema, and 2) VEP and OCT are objective practical diagnostic valuable simple techniques for monitoring functional and anatomic improvement following intravitreal corticosteroid injection.


Key words: Intravitreal, triamcinolone acetonide, diabetes mellitus, diffuse macular edema


Abbreviations

Clinically significant macular edema (CSME), visual acuity (VA), visual evoked potential (VEP), Optical Cohedence Tomography (OCT), Intraocular pressure (IOP), intravitreal triamcinolone acetonide (IVTA)

INTRODUCTION

Diabetic macular edema is the major cause of visual loss in patients with diabetes mellitus. (2) Up to 78% of non-insulin dependent diabetics with retinopathy have been found to have diffuse or focal macular edema. (17) Approximately one-fifth of the newly diagnosed diabetic patients develop maculopathy (36) and half of them lose one or more lines of visual acuity after follow up for 2 years. (10) Although the use of laser photocoagulation result in marked reduction in the incidence of blindness from diabetes during the past 20 years (8), in contrast, many studies reported poor prognosis after laser photocoagulation. (16) After laser photocoagulation, improvement was reported in 29.6%, while stabilization and deterioration was reported in 37% and 33.3%, respectively. (5) Early treatment diabetic retinopathy study research group (ETDRS) reported that about 24% of immediately treated eyes had thickening involving the center of the macula at 36 months (27), which encourages the interest for other treatment modalities. (35) In the last 2 years, utilization of intravitreal triamcinolone acetonide has been exponentially increased as a treatment option for various intraocular neovascular and proliferative edematous disorders. (15) Recently the risk of further deterioration of visual acuity from diffuse diabetic macular edema has been found to be reduced with repeated intravitreal corticosteroid treatment. (20) The best response was obtained in cases of intraretinal edematous diseases such as diffuse diabetic macular edema. In addition, this response is dose dependent following single intravitreal injection. (15)

Aim of the work

Our objectives in this study were: 1) to prospectively (at baseline and after follow up period of 1-, 3- and 6-months) investigate the efficacy and safety of one intravitreal injection of 4 mg (0.1 ml) of triamcinolone acetonide (IVTA), as a primary treatment in patients suffering from diffuse clinically significant macular edema (CSME) caused by diabetes mellitus, and 2) to monitor objectively the functional and anatomic improvement in patient’s vision. Measuring visual acuity (VA) and visual evoked potential (VEP) were utilized to assess and monitor visual function and Optical Coherence tomographic (OCT) was utilized to quantitatively measure macular thickness and volume.

PATIENTS AND METHODS

The study design is clinical, interventional, nonrandomized and comparative. In this study, no placebo controls were undertaken for fear of exposing subjects to risks of intravitreal injection without any benefit. Included in this study were 24 patients (24 eyes evaluated) with diffuse clinically significant macular edema (CSME). Their ages ranged from 38 to 65 years (mean; 55.25±14.94, male/female; 10/14), duration of diabetes mellitus (D.M.) ranged from 3 to 15 years (mean, 8.92±5.81) and duration of visual impairment ranged from 8 to 36 months (21.75±13.82). Patients were recruited from the outpatient Ophthalmology and Neurology clinics, Assiut University Hospital, Assiut, Egypt. This study was approved by the regional ethical committee. Informed written consent was obtained from all subjects before their participation in this study. Excluded from this study were patients with diminished visual acuity due to causes other than D.M., including, a) opaque ocular media, b) patients previously treated for their macular edema by other modalities of therapy, and c) patients with known history of high intraocular pressure (IOP) or glaucoma. All patients underwent full medical, neurological and opthalmological history and examination. Forty healthy control subjects were included for comparison. Functional and anatomic monitoring was done for all patients. The functional response was assessed by VA and VEP measurements. The anatomical response was assessed by OCT utilized to quantitatively measure the macular thickness and volume. Baseline visual acuity (VA), visual evoked potential (VEP) and Optical Coherence tomographic (OCT) assessments were undertaken pre- and post- treatment, after 1-, 3- and 6-month(s) follow up injection.

Full opthalmological examination included:

1) visual acuity measurement by Landolt broken ring chart, 2) intra-ocular pressure (IOP) measurement by Goldmann applanation tonometry. The angle of the anterior chamber was measured by Goldmann 3-mirror lens, 3) determination of lens clarity by slit-lamp examination with a +78 or +90-diopter lens, and 4) fundus examination using direct opthalmoscope and Volk +90 lens (Heidelberg Retina Angiograph, Heidelberg Engineering GmbH, Heidelberg, Germany), 5) evaluation of the macula by slit lamp biomicroscopic fundus examination for detection and assessment of the degree and grading of CSME. The latter is defined if one or more of the following characteristics was present: (a) thickening of the retina at or within 500micron of the macular center, (b) hard exudates at or within 500micron of the center of macula, if associated with thickening of adjacent retina, and (c) zone(s) of retinal thickening one disc area or larger or at any part of which is within one disc diameter of the center of macula. (35)

Visual evoked potential:

Pattern reversal visual evoked potentials (PRVEPs) with checks of 16′ of Dantec Keypoint equipment Medtronic, Copenhagen, Denmark, was done in the Neurology department, as described before. (33) VEP is a sensitive method to detect early abnormalities within the optic pathway. Recording over the mid-occiput, PRVEP usually has a negative-positive-negative configuration, in normal subjects the major positive peak occurs at 100msec (P100). Peaks are labeled using the average latency values in normal subjects: N75, P100 and N145. VEP amplitudes are more variable. We measured the amplitude as the sum of the peaks from N75 to N100 and that of P100 to N145.

Optical Coherence Tomography (OCT):

Optical Coherence Tomography (Stratus OCT 3, software version 4, Zeiss-Humphrey, Germany) provides enhanced visualization of the geometry and distribution of macular edema. It was utilized to quantitatively measure the central macular thickness and macular volume, using 850 nm superluminescent diode at maximum intensity of 750W. All eyes were scanned with 6 radial lines centered on the central fovea, with each line 5.0mm long. The location of the central fovea was determined by patient’s fixation. The macula was divided into 3 regions, including a central disc (1000m in radius), middle (3000m) and an outer ring (6000m). Each region corresponds to the fovea, parafoveal and perifoveal area, respectively. Each region was further divided into superior, inferior, temporal and nasal quadrants. The retinal thickness, defined as the length between inner retinal surface and retinal pigmented epithelium, was measured by the computer from the tomograms. The images of OCT were displayed in a false-color scale where bright colors, such as red and white indicate highly reflective areas and dark colors, while blue and blacks correspond to low reflective areas.

Injection procedure:

Patients rested in a supine position to allow the steroid to settle posterior. 5% povidone iodine solution was applied to the eye prior injection. A lid speculum was placed onto the eye and 0.5ml of 2% lidocaine was injected in the inferior temporal subconjunctival space. An individual unopened 1 ml (40mg) vial of triamcinolone acetonide (Kenalog 40; Apothecon, Princeton, NJ) was mixed and 0.1 ml (4 mg) was drawn into a tuberculin syringe. Injection was done slowly through the inferior pars plana (3.5-4mm from limbus measured with calipers) using a 27 gauge needle (Tip Box 3). The drug is injected slowly and directed posteriorly. Indirect ophthalmoscopy was used to confirm proper intravitreal localization of the suspension and perfusion of the optic nerve head. Intraocular pressure (IOP) was measured and if increased, aspiration of equal amount (0.1 ml) was undertaken through paracentesis incision down and out. The potential complications related to the injection procedure and corticosteroid medication were monitored, including IOP response, cataract progression, retinal detachment, vitreous hemorrhage, and endophthalmitis.

Statistical analysis:

All the data were analyzed by the SPSS, version 10. Calculation of the normal limits of electrophysiological data was done utilizing parametric (t-test and Pearson’s correlation) and non-parammetric statistics (Spearman rank), when the distribution in normal individuals is non-gaussian (e.g. amplitude distribution). Data were set in mean±SD. Chi-square test was applied for binomial data. The differences between patients and controls and pre- and post- intravitreal injection concerning continuous variables were analyzed by Student’s t-test for unpaired samples or the Mann-Whitney U-test, when appropriate. For all tests, P<0.05 was set as significant.
RESULTS

In this prospective, non-comparative study, 24 patients (24 eyes evaluated) with diffuse clinically significant macular edema (CSME) were included. Demographic data are summarized in Table 1. The amplitude of visual evoked potential (VEP) was significantly lower in eyes with macular edema than in control eyes (7.31±2.23 vs.18.1±2.5 µV for control; P<0.001). But no significant difference in latency was found (99.93±2.5 vs. 98.0±2.1 msec for control) (Tables 2, 4). Best corrected visual acuity was not ascertained which makes comparisons less meaningful and do not allow determination of moderate visual loss or gain, however, we tested all eyes with the same correction throughout the follow up period. The corrected visual acuity and the electrical response density from the macular area were significantly reduced in eyes with diabetic macular edema (Table 3). Compared to controls, the mean initial pretreatment central macular thickness and the total macular volume were significantly increased (375±35.50 micron; p<0.0001 and 10.39±4.87mm3; p<0.001 respectively) (Table 3, 4). The mean baseline intraocular pressure (IOP) was 13.92±3.85 mmHg (Tables 2, 4). The pre-operative central macular thickness and the visual acuity were positively correlated with total macular volume (r=0.676, p<0.001 and r=0.715, p<0.001 respectively) and duration of visual deterioration (r=0.512, p=0.003). The pre-operative corrected visual acuity and VEP amplitudes were inversely correlated (r=0.680, p<0.001). VEP was inversely correlated with macular thickness (r=0.678, p<0.001) and visual acuity (r=0.596, p<0.001). Authors observed a significant improvement in most of the patients, both functionally and anatomically during spanning the first, third and six month(s) follow up period after treatment (Tables 2, 3, 4). Visual evoked response showed marked improvement in amplitude from initial 7.31±2.23 to 15.37±3.88 (P<0.001), 26.69±3.72 (P<0.001) and 25.65±2.28 µV (P<0.001) (Table 4). Macular thickness was reduced from initial 375±35.50 to 233.33±40.17 (P<0.001), 145.83±27.58 (P<0.001) and 202.46±29.60 micron (P<0.01). Macular volume was reduced from initial 10.39±1.87 to 7.73±1.01 (P<0.001), 6.55±0.99 (P<0.01) and 6.61±1.09 micron (P<0.01). IOP was elevated from 13.92±3.85 to 20.58±8.42 mmHg (P<0.001) at the end of the first month and decreased significantly to 15.83±4.15 mmHg and 14.63±1.46 (P<0.001, P<0.001 and P=NS) at the end of the third and sixth months follow up periods respectively (Table 4). Six patients (25%) showed decline of visual acuity at the end of 6-months follow-up periods due to recurrence of edema and necessitated reinjection (Table 3).
DISCUSSION

Macular edema is one of the important causes of visual loss in patients with diabetic retinopathy. Breakdown of the blood-retinal barrier with increased vascular permeability and fluid accumulation in the inner layer of the retinal is accepted as possible pathogenesis of diffuse diabetic macular edema. (6) Histopathological studies in macular edema indicate that fluid leaks out of the damaged retinal vessels, enters Müller cells and causes intracellular swelling, especially in the outer plexiform layer. (39) The causes of such breakdown in diabetes mellitus (D.M.) is not fully clear, however, the increased permeability and angiogenesis that occur in diabetic retinopathy was suggested to result from changes in ocular growth factors including: insulin-like growth factor-1 and its binding proteins, platelet derived growth factor, fibroblast growth factor and vascular endothelial growth factor. (1, 3)

Diabetic clinically significant macular edema (CSME) was reported to have poor prognosis with laser photocoagulation compared to focal macular edema. (20, 22) Moderate visual loss was mainly studied by the Early treatment diabetic retinopathy study research group (ETDRS) and improvement in 3 lines was observed only in <3% of patients after laser photocoagulation. (27) Recently pars plana vitrectomy has been advocated for treatment of diffuse macular edema but found to be applicable to a selected subset of patients and requires significant surgical intervention with inherent risks, recovery time and expenses. (14, 26) Application of local corticosteroids for treatment of diffuse diabetic macular edema has been shown to be effective at both experimental and human studies. (37) Corticosteroids are traditionally used for inflammatory disorders because of their ability to diminish neutrophil transmigration, limit access to sites of inflammation, and decrease cytokine production. It inhibits the arachidonic acid pathway, a product of prostaglandins. More recently, investigators have focused on the angiostatic and antipermeability properties of corticosteroids for posterior segment diseases, diabetic retinopathy, and macular edema (7) and found that in proliferative diabetic retinopathy, steroids may directly downregulates the production of growth factors such as vascular endothelial derived growth factor and inhibit leukocytes that play an important role in early microvascular alterations. Corticosteroids has been found to reduce the breakdown and stabilizes the blood-retinal barrier and hence the rationale for its introduction for treatment of diabetic macular edema. (37) Recently, corticosteroid has been found to increase barrier properties of retinal endothelial cells and at the same time induces specific changes to the tight junction proteins. It has been found to induce assembly of the synthesized tight junction proteins hence reducing the endothelial cell transport of water and solute, provides increased barrier properties and forms molecular basis that account for the change in transport properties. (29) Tight junctions create a selective barrier to water and solutes, blocking paracellular flux across the tissue and preventing lipids and proteins from diffusing between the apical and basolateral plasma membranes. The tight junctions or zonula occludens has been shown by electron microscopy as a series of anatomizing fibrils that encircle most of the apical regions of the CNS and retinal capillaries cells. (9, 34) A number of proteins have been located at tight junctions and are believed to provide the structural basis of tight junctions, as well as a range of proteins has been found to be potentially involved in the regulation of barrier permeability. (11, 23) The above results provide novel insights into the molecular basis by which corticosteroid treatment prevents tissue edema and provides a rationale for localized corticosteroid treatment for diabetic retinopathy. Intravitreal triamcinolone (IVTA) is an emerging interventional promising therapeutic method for treatment of diabetic macular edema. (20) After intravitreal injection, the drug is delivered rapidly to its site of action with maximal bioavailability with half life of 1.6 days (32) and long lasting effect of 21 to 41 days. (30, 32) Our results highly suggest and recommend the use of IVTA as a primary treatment of diffuse diabetic macular edema. In the light of the characteristics of the studied group of patients, the results of this study indicate progressive marked observed improvement in vision when functional and anatomic assessment was done utilizing VA and VEP for visual function and OCT for quantitative anatomic evaluations. The foveal thickness measured by OCT and VEP amplitude were correlated well with the visual acuity as previously reported. (25, 31) It has been found that traditional methods of evaluating macular thickness, such as ophthalmoscopy or stereoscopic biomicroscopy, are insensitive to detect small changes in retinal thickness and intraretinal structures (40, 41), however, the advent of OCT offers the possibility of both high-resolution cross-sectional images of the retina and quantitative measurements of the retinal thickness. (12, 13) Due to the higher density of Müller cells at the foveal floor than at the retinal edges, the low reflectivity space in the outer retina of the optical coherence tomogram may represent the swollen Müller cells in the outer plexiform layer as marked retinal thickening has shown to be reflected by the abundant swollen or ruptured Müller cells in the fovea and parafoveal areas. (25, 28) The results of this study demonstrated that the reduced amplitude of the VEP depends on the reduced visual acuity with no significant change in latency. VEP has been shown to be appropriate for objective assessment of the function of the underlying macula and evaluating the degree and progression of the disease. (4, 19, 24) Combination of OCT and VEP might be thought to provide objective criteria for the evaluation, assessment and follow up of diabetic macular edema. Many previous studies demonstrated the safety and efficacy of IVTA in treatment of diabetic macular edema that fails to respond to conventional photocoagulation. In the study of Martidis et al. (20), IVTA was utilized to treat 16 eyes with CSDME, which was subjected to initial laser photocoagulation therapy at least 6 months before steroid injection. Authors reported improvement in mean visual acuity and macular thickness spanning 1-, 3-and 6-month(s) follow up intervals. No significant complications were observed that prohibited further injection and 3 eyes necessitated re-injection due to recurrence of edema detected after 6 months follow up period. In our study, only elevated IOP was observed during follow-up period but decline to values near baseline at the end of the third and sixth months. No other complications were reported that prohibited further injection. Six patients (25%) reported deterioration at the end of 6 months follow up due to recurrence of edema that necessitated re-injection and this is consistent with other studies. (20) The safety of intravitreal corticosteroids has been supported by many animal (21) and human studies. (18, 20, 38) The major previously reported ocular side effects include secondary ocular hypertension or glaucoma (reported in up to 40% of eyes injected) and cataract. Others include; postoperative infectious and non-infectious endophthalmitis, and pseudo-endophthalmitis. (15) Cataract progressive was usually seen with long up follow up period (>= 6 months). (20)

CONCLUSIONS

To our knowledge, this is the first report of utilizing intravitreal triamcinolone acetonide as a primary treatment in diffuse diabetic macular edema. Based on the above results, we concluded that 1) Intravitreal triamcinolone acetonide is safe and effective as primary treatment for diffuse chronic diabetic macular edema, however, large numbered controlled trials are needed, and 2) VEP and OCT are valuable objective diagnostic and practically simple techniques for assessment and monitoring the anatomic and functional improvement following intravitreal corticosteroid injection for treatment of diffuse diabetic macular edema.

Table 1: Pretreatment clinical characteristics

Pat.# Sex age Type of diabetes Eye Retinopathy Duration of diabetes mellitus (years) Duration of macular edema (month)
1 F 55 Non insulin dependent Right Severe NPDR 3 24
2 F 60 Non insulin dependent Left Severe NPDR 15 36
3 M 59 Non insulin dependent Right Moderate NPDR 12 18
4 F 65 Non insulin dependent Right PDR 15 21
5 F 55 Non insulin dependent Right Moderate NPDR 7 16
6 M 38 Non insulin dependent Left Moderate NPDR 5 8
7 F 51 Non insulin dependent Right Severe NPDR 10 12
8 M 55 Non insulin dependent Right Severe NPDR 10 26
9 F 65 Non insulin dependent Left Severe NPDR 5 36
10 F 55 Non insulin dependent Left Severe NPDR 7 24
11 M 65 Non insulin dependent Left Moderate NPDR 12 16
12 F 45 Non insulin dependent Right Severe NPDR 6 24
13 M 40 Non insulin dependent Left Moderate NPDR 12 16
14 F 55 Non insulin dependent Left Moderate NPDR 15 12
15 F 51 Non insulin dependent Right Severe NPDR 10 36
16 F 60 Non insulin dependent Right PDR 13 24
17 M 45 Non insulin dependent Right Moderate NPDR 5 26
18 M 55 Non insulin dependent Left Moderate NPDR 3 24
19 M 38 Non insulin dependent Left Moderate NPDR 3 16
20 F 50 Non insulin dependent Left Severe NPDR 5 8
21 F 58 Non insulin dependent Left Severe NPDR 10 24
22 M 45 Non insulin dependent Right Moderate NPDR 7 26
23 M 50 Non insulin dependent Right Moderate NPDR 12 24
24 F 38 Non insulin dependent Left Severe NPDR 10 12

NPDR = nonproliferative diabetic retinopathy

PDR = proliferative diabetic retinopathy

Table 2: Visual evoked potential and intraocular pressure evaluation (pre- and post-treatment)


Pat. # Visual Evoked Potential Intraocular pressure
Latency (msec) Amplitude (µV) (mmHg)
Initial 1 m 3 ms 6 ms Initial 1 m 3 ms 6 ms Initial 1 m 3 ms 6 ms
1 103 105 100.6 100 5.3 12.2 32.5 6.5 15 18 16 10
2 105 104.5 99.7 100.5 4.3 15.5 26.8 30.5 10 17 16 15
3 98.5 95.4 98.2 96.8 10.6 12.5 20.6 23.8 15 28 20 17
4 99.8 96.7 100.2 100.5 8.5 16.8 28.4 30.5 14 21 17 18
5 104 102.6 98.8 99.5 8.1 17.3 23.6 25.8 17 20 14 12
6 97.6 96.1 100.6 100.2 11.5 20.3 23.2 27.1 18 30 17 15
7 101.9 102.3 98.5 100.6 8.5 12.2 25.8 28.1 14 20 12 16
8 86.6 89.3 92.1 89.5 10.7 18.8 27.8 18.5 10 17 18 14
9 100.4 98.6 100.1 99.5 4.2 15.8 25.8 27.5 17 23 16 18
10 99.5 103.6 101.5 102.4 6.4 11.5 27.1 23.7 15 18 16 12
11 104 99.5 98.9 103 5.6 13.7 30.5 15.5 10 15 12 10
12 98.8 100.5 97.7 99.8 3.9 17.8 28.2 30.5 12 20 16 15
13 98.5 95.4 98.2 100.2 10.6 12.5 20.6 25.8 15 28 20 18
14 104 102.6 98.8 96.2 8.1 17.3 23.6 30.5 17 20 14 18
15 103 105 100.6 102 5.3 12.2 32.5 15.9 15 18 16 15
16 99.8 96.7 100.2 95.4 8.5 16.8 28.4 30.5 14 21 17 12
17 101.9 102.3 98.5 100.2 8.5 12.2 25.8 28.2 14 20 12 10
18 105 104.5 99.7 98.9 4.3 15.5 26.8 30.4 10 17 16 14
19 98.8 100.5 97.7 100.2 3.9 17.8 28.2 35.4 12 20 16 15
20 104 99.5 98.9 98.5 5.6 13.7 30.5 28.9 10 15 12 16
21 101.9 102.3 98.5 104 8.5 12.2 25.8 17.8 14 20 12 18
22 98.5 95.4 98.2 96.7 10.6 12.5 20.6 28.7 15 28 20 16
23 104 99.5 98.9 102.5 5.6 13.7 30.5 28.6 10 15 12 12
24 98.8 100.5 97.7 102 3.9 17.8 28.2 16.8 12 20 16 15


Table 3: Evaluation of visual acuity and Optical Cohedence Tomography (pre- and post-treatment)


Pat. # Visual acuity Optical Cohedence Tomography (OCT)


Central thickness (m) Total volume (mm3)

Initial 1 m 3 ms 6 ms Initial 1 m 3 ms 6 ms Initial 1 ms 3 ms 6 ms
1 4/60 6/24 6/12 6/36 624 371 214 480 12.67 8.76 6.45 7.23
2 6/60 6/36 6/24 6/18 546 195 105 100 13.08 8.44 7.05 6.99
3 6/60 6/24 6/12 6/12 180 170 160 150 8.25 6.52 5.08 5.70
4 6/60 6/24 6/12 6/9 275 225 180 105 8.48 6.99 6.05 5.08
5 6/60 6/24 6/12 6/9 250 160 120 120 7.11 6.59 6.05 5.23
6 6/18 6/9 6/9 6/9 175 133 105 110 8.62 7.81 6.88 6.52
7 4/60 6/36 6/36 6/18 356 287 213 180 12.01 8.07 7.55 7.05
8 3/60 6/24 6/12 6/36 336 229 180 257 8.34 7.23 6.15 8.42
9 6/60 6/36 6/24 6/18 534 225 180 120 12.07 8.56 7.48 6.45
10 6/60 6/36 6/24 6/12 326 257 207 160 12.71 8.37 6.78 6.05
11 6/36 6/24 6/18 6/36 334 214 180 225 8.48 7.18 6.18 8.52
12 4/60 6/36 6/24 6/18 575 334 225 207 12.84 8.54 6.84 5.08
13 6/60 6/24 6/12 6/9 180 170 160 105 8.25 6.52 5.08 4.88
14 6/60 6/24 6/12 6/12 180 170 160 150 8.25 6.52 5.08 5.25
15 4/60 6/24 6/12 6/24 624 371 214 470 12.67 8.76 6.45 8.76
16 6/60 6/24 6/12 6/12 275 225 180 160 8.48 6.99 6.05 5.84
17 6/60 6/24 6/12 6/12 180 170 160 140 8.25 6.52 5.08 5.02
18 6/60 6/36 6/24 6/18 546 195 105 98 13.08 8.44 7.05 6.84
19 6/60 6/36 6/24 6/12 326 257 207 180 12.71 8.37 6.78 6.05
20 4/60 6/36 6/24 6/12 575 334 225 180 12.84 8.54 7.84 6.52
21 6/60 6/24 6/12 6/36 250 160 120 287 7.11 6.59 6.05 8.76
22 6/36 6/24 6/18 6/12 334 214 180 120 8.48 7.18 6.18 5.58
23 4/60 6/36 6/36 6/24 356 287 213 180 12.01 8.07 7.55 6.25
24 6/60 6/36 6/24 6/60 534 225 180 575 12.07 8.56 7.48 10.68


Table 4: Results of intravitreal triamcinolone injection (mean ± SD; P-value)

Assessment Initial 1 month 3 months 6 months
VEP (P100), msec
Mean ± SD 99.93±2.5 99.51±4.04 100.13±9.14 95.53±4.47
Normal
Mean ± SD 98.0±2.1
P-value P1: NS P2: NS P2: NS P2:NS
VEP (amplitude), µV
Mean ± SD 7.31±2.23 15.37±3.88 26.69±3.72 25.65±2.28
Normal
Mean ± SD 18.1±2.5
P-value P1 < 0.001 P2 < 0.001 P2 < 0.001 P2<0.001
Central thickness, µm
Mean ± SD 375±35.50 233.33±40.17 145.83±27.58 202.46±29.60
Normal
Mean ± SD 170.35±15.20
P-value P1< 0.001 P2 < 0.001 P2 < 0.001 P2 < 0.001
Macular Volume, mm3
Mean ± SD 10.39±1.87 7.73±1.01 6.55±0.99 6.61±1.09
Normal
Mean ± SD 5.85±1.50
P-value P1< 0.001 P2 < 0.001 P2 < 0.01 P2<0.01
Intraocular pressure, mmHg
Normal
Mean ± SD 13.92±3.85 20.58±8.42 15.83±4.15 14.63±1.48
P-value P1 < 0.001 P2 < 0.001 P2 < 0.001 P2: NS

P1: initial vs. control values.

P2: one, three, six months follow up results vs. initial values

NS: non significant

  • Articles récents

  • Commentaires récents

  • Archives

  • Catégories

  • Méta


  • © 2002-2018 African Journal of Neurological Sciences.
    All rights reserved. Terms of use.
    Tous droits réservés. Termes d'Utilisation.
    ISSN: 1992-2647